Ever wondered how to evaluate or find out how many users are visiting your SharePoint Site? Forget about just visiting, would you be interested in knowing what they are editing or viewing, even if it’s a project team site, department site or executive workspace?
I’m not talking about a custom feature that needs to be deployed to SharePoint; it’s an available feature for you to configure to get started!
This requirement came in from one of our customers from the Far East where the organization wanted to evaluate the effectiveness of SharePoint User Adoption. They want to know which users are editing the files or viewing them, kidding. The client is a leading food products manufacturer that has distribution channels across the globe. With over 700 executives working on the intranet portal from different locations, this feature is a necessity.
Let’s explore on how to get this feature done on your SharePoint:
Step 1# Using Site Collection Audit Log Reporting Feature
This feature helps you to track activities based out of the whole site collection. There are couple of ways to do this, however, for SharePoint On-Premise Customers, this is the only way to track User Activities in SharePoint.
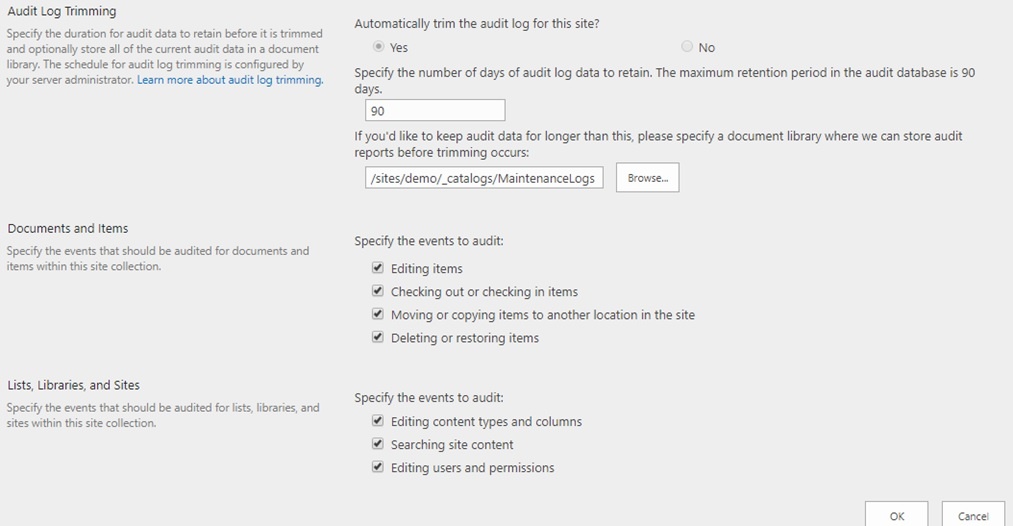
1. Go to Site Settings from the Root Site, and move to Site Collection Administration (Right Side) and click on site collection audit settings.
2. Select the desired options you wish to track in the Audit Report.
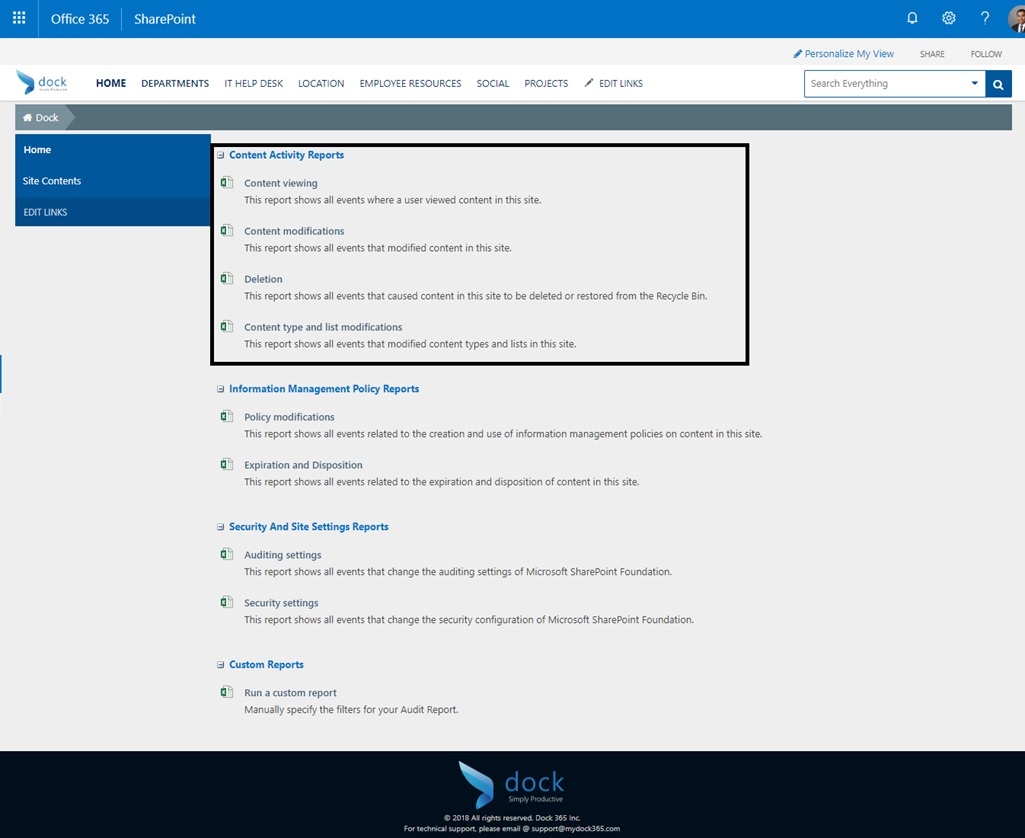
3. Once saved, select the Audit Log Reports option. It displays the available report for you to generate/view.
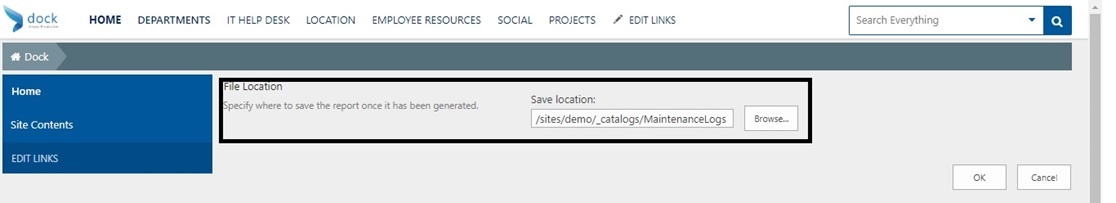
4. Before generating the report, it is important to specify the folder you wish to store the reports. As shown in the image below, specify the document library where your reports need to be saved.
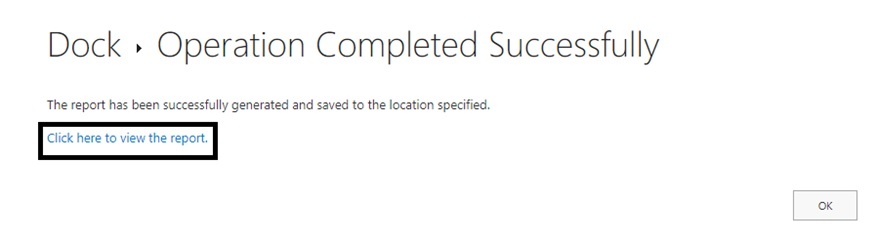
5. You will get a confirmation screen upon choosing the folder as shown below. Select “Click here to view the report” to generate the report.
6. You will be directed to a spreadsheet with the information.
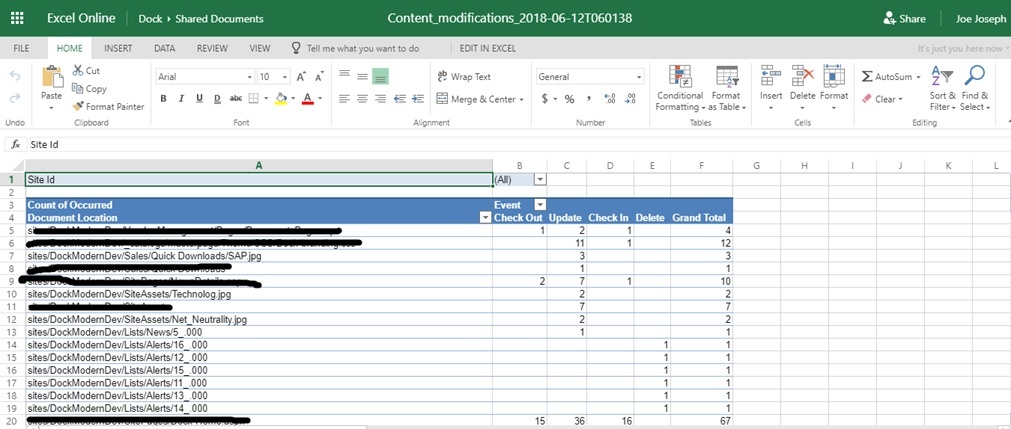
I do admit that you won’t be able to generate fancy charts/presentations out of this.
Please note that “Content Viewing Report” doesn’t work on SharePoint Online.
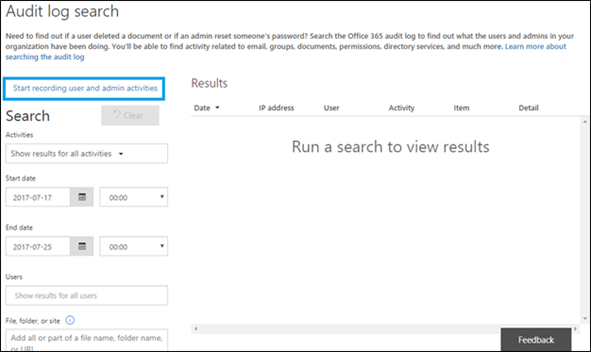
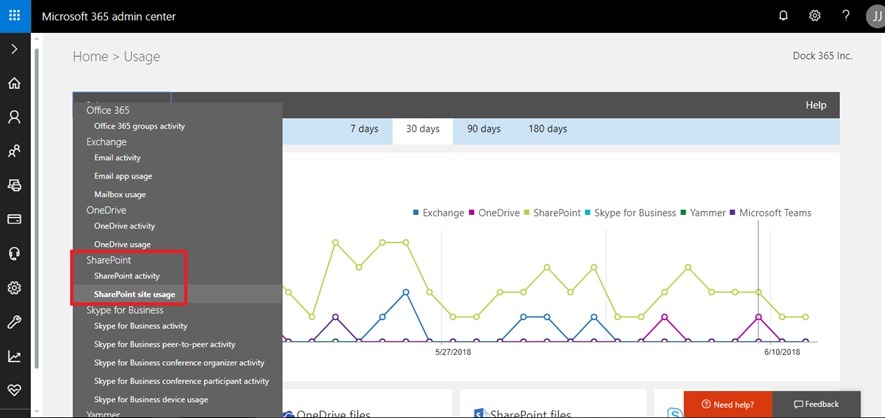
Step 2# Using Office 365 Admin Center
This is a great place to work on the SharePoint Usage. Compared to the previous usage tracking, this feature allows you to track all the activities done when you had setup the site. The previous method only starts tracking once you have configured in the Audit Settings.
- Select Admin Tiles from the Office 365 App Launcher
- On the right-hand side, scroll towards the graph called Usage Graph
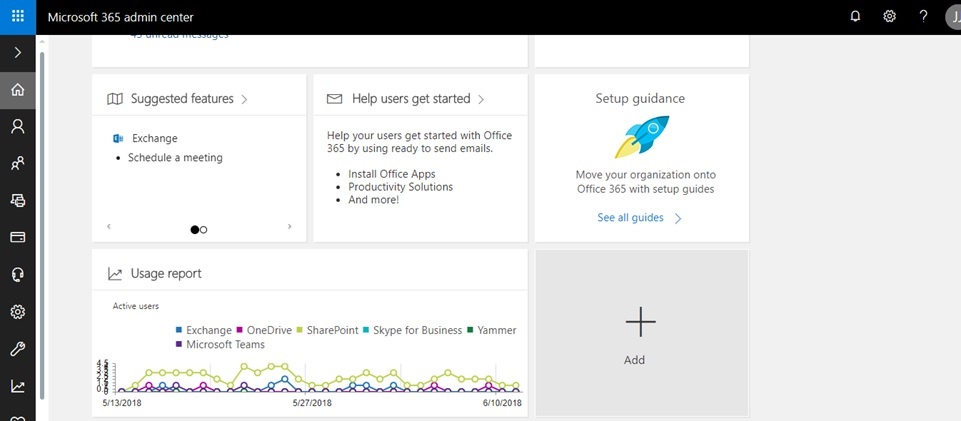
You also have a provision to filter your graphs/reports based on solutions/activity:
Isn’t it wonderful? I really enjoy working on these reports! You should try them for sure.
There are couple of more ways to do it using Microsoft PowerBI and via Modern Sites. Stay tuned for the second part of this blog and subscribe to our SharePoint tips today!

Book a Live demo
Schedule a live demo of Dock 365's Contract Management Software now.