
Hello everyone! Welcome back to our Blog-Series: Latest Power BI Desktop Feature Updates-Part II. In case, you missed out on Part I of the blog series, please click below to read
Blog-Series: Latest Power BI Desktop Feature Updates-Part I.
In this blog, we will be showcasing the updates pertaining to Analytics.
Analytics
Conditional formatting by values
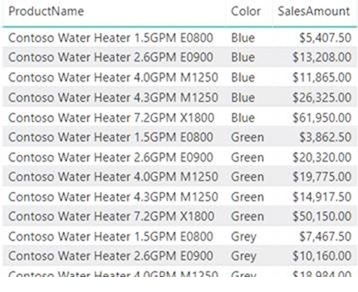
With the new Format by field value you can use a measure or column to specify a color, either through a hex code or name and apply that color to the background or font color.
As shown in the image below, each product in the model has a color but rather than showing the name of the color, you can fill the cell with the color instead. All thanks to the new update!
Steps
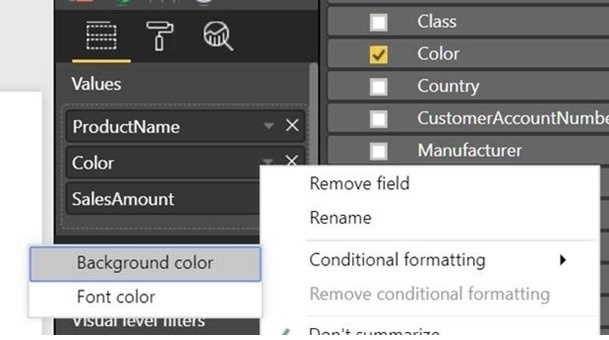
- Open the conditional formatting dialog for the color column in the table.
- Choose to format by Field value
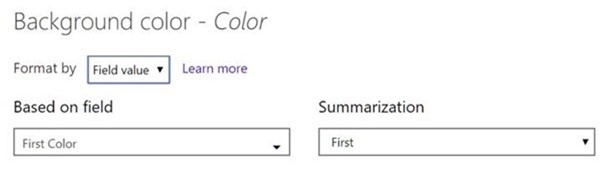
- By default, in the dialog box the color column with First is for summarization
- Select okay as you have one color value per table row
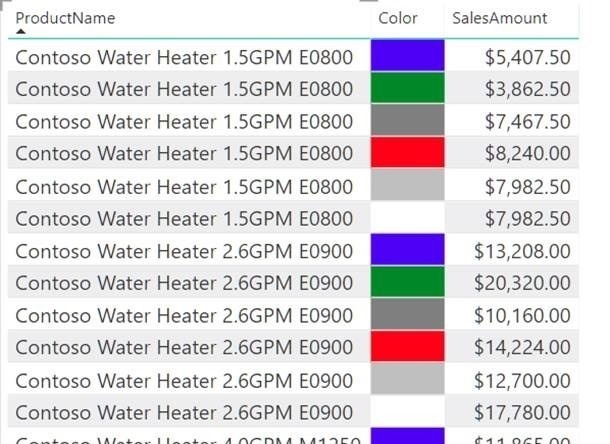
- Repeat the same for font color to fill the whole column with the product color as depicted below
Python integration (preview)
Python integration into Power BI Desktop is here to empower users to do data analysis, cleansing and visualization.The programming language is widely used by data scientists, and data analysts across the globe.
The first integration experience comes as the ability to run Python scripts directly in Power BI Desktop. The new update enables users to perform advanced data analytics, shaping, clustering, data prediction, completion of missing data and much more.
Steps
- You can see the new option “Python script” in the Get data dialog.
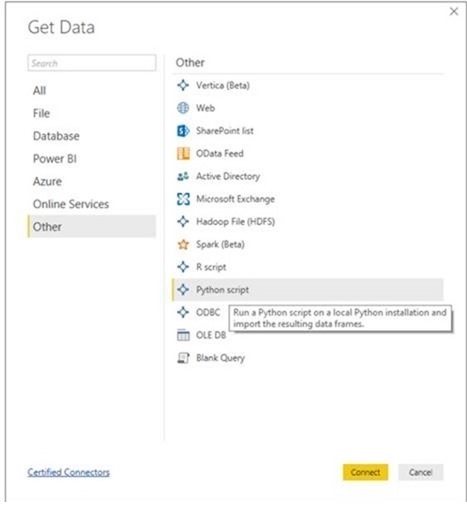
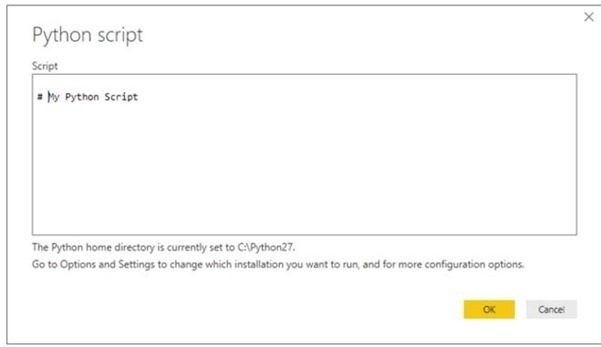
- Once you select the option, you will be able to paste in your script
You can also create new visuals in your report using Python. The visuals are not interactive and will update with data refreshes and cross-filtering.
Q&A improvements
With the new update, Q&A in Power BI Desktop will now be generally available. Thus, users will no longer need to turn on the preview feature to use Q&A Explorer in reports or Q&A for visual creation.
In addition, Q&A in Power BI premium capacity and in Power BI Desktop now comes with improved matching capabilities against data in user’s model. To achieve this, values are compared word-by-word rather than the complete value in one go. It ensures better matching when it comes to spelling-correction, plurals, and punctuation.
Well, that’s all for today. Stay tuned for Part III of the blog series that talks about exciting custom visuals updates. If you have any questions regarding the integration of Power BI and real time data into Dock 365, using SharePoint - Click below to schedule a Free Demo!

Book a Live demo
Schedule a live demo of Dock 365's Contract Management Software now.