
With an aim to enable rapid development of enterprise-wide security reports, Microsoft launched a Microsoft Graph Security connector for Power BI along with a sample dashboard and template.With the new tool, users gain greater visibility into active threats and trends thus enabling them to better manage security and risk.Not just that you can now get a complete picture of your security alerts and secure score information across multiple security solutions with the cool dashboards.Further,you can mash up security data with data from the other Power BI connectors for richer context. The Power BI connector for Microsoft Graph also reduces the time and resources needed to integrate multiple data sources, simplifying the creation of reports across security solutions. You can integrate these graphs in solutions like contract management system and get a better picture of your data.
Let's get started
The connector is included in the Power BI Desktop February 2019 update.
- You must first get consent from your Azure Active Directory (AD) tenant administrator for the connector
- Install the Power BI Desktop February 2019 update
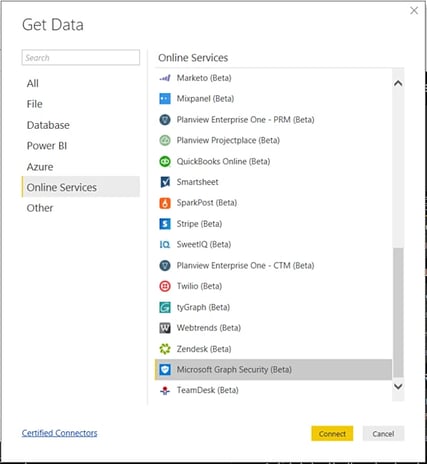
- In the Home ribbon of Power BI Desktop, select Get Data →More
- From the categories list, select Online Services
- Select Microsoft Graph Security (Beta) and click Connect.
- Choose a Version (v1.0 or beta)
- When prompted, sign into Azure Active Directory
- Your user account needs to have Security Reader role permissions per user and delegated Microsoft Graph Security authorization requirements.
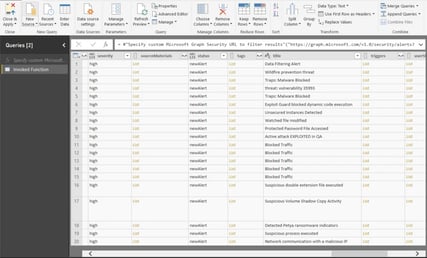
- Select the entity of choice and click load to display results as depicted below
Visualize Alerts across different Security Products
Now depict alerts originating from different security products deployed in your organization in a visually appealing manner as seen below.
.png?width=998&name=Dashboard-Alerts_By_Security_providers_trend%20(1).png)
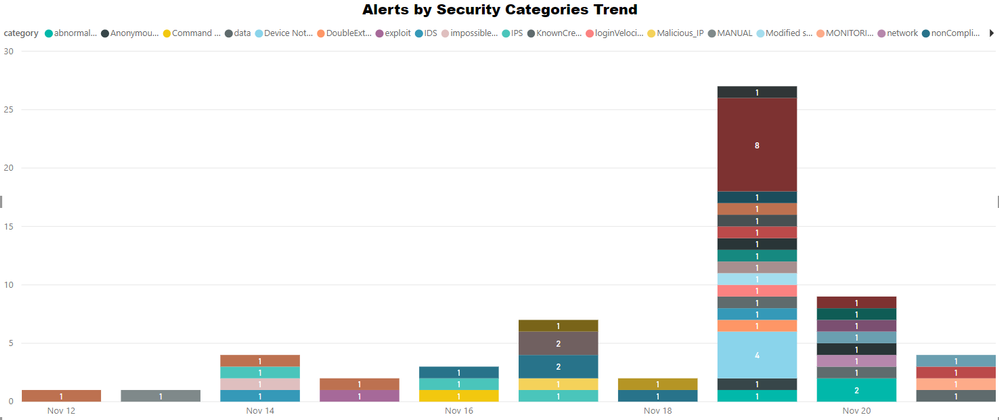
Visualize Top Threats Targeting your Organization
As seen below, you can now create visuals depicting top threats that impact your organization. This is achieved by categorizing security alerts across the different security products deployed in your organization.
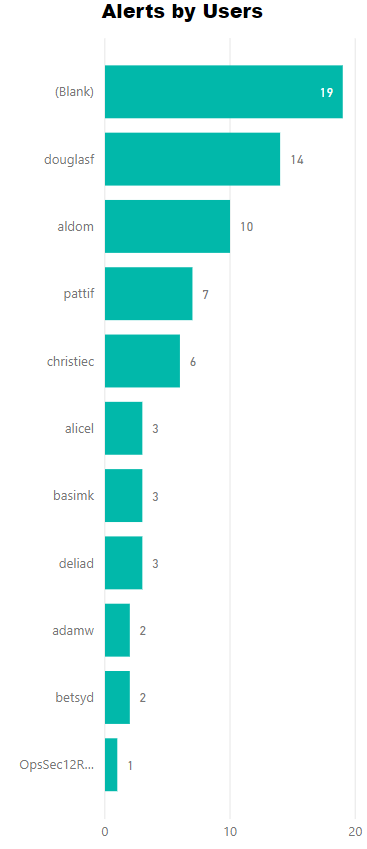
Visualize Top Targeted Users
Manage user risk information and potential top targeted users with a pictorial representation of users as seen below. It provides a clear picture of who was associated with the security alerts that originated from the different security products deployed in your organization.
With the integration of these graphs to your contract management system or project management tool you can always view the progress from the solution itself, without having to switch to Power BI. These graphs will be more resourceful for managing contracts, contract management system deals with numbers, what better way to represent your numbers than a well plotted graph.

Book a Live demo
Schedule a live demo of Dock 365's Contract Management Software now.

.webp)