
Microsoft Office tools take data processing to a whole new level. Considering SharePoint, this platform is used for efficient sharing, processing, and use of data. SharePoint offers a unique feature that leverages charts and graphs to showcase data. In this blog, we'll teach you how to use the SharePoint Quick Chart web part to easily design pie charts and column graphs in your SharePoint pages.
Ways To Use the Quick Chart Web Parts
The SharePoint Quick Chart web part allows users to instantly create charts and graphs that are visually appealing and easy for teams to understand. This is certainly a step above the traditional spreadsheet.
Effortlessly showcase the status of your projects, lists, and marketing figures with the Quick Chart web part. Now let's go ahead and learn how to add a chart on the web.
How To Add a Quick Chart Web Part to a SharePoint Page
Complete the following steps to add a Quick Chart web part to a SharePoint page:
- Go to the SharePoint page that you'd like to add the web part to.

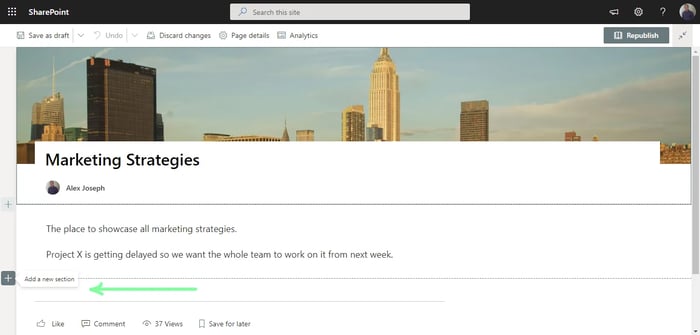
- Click Edit in the top right.
- Click on the + icon to add a section for the new web part.
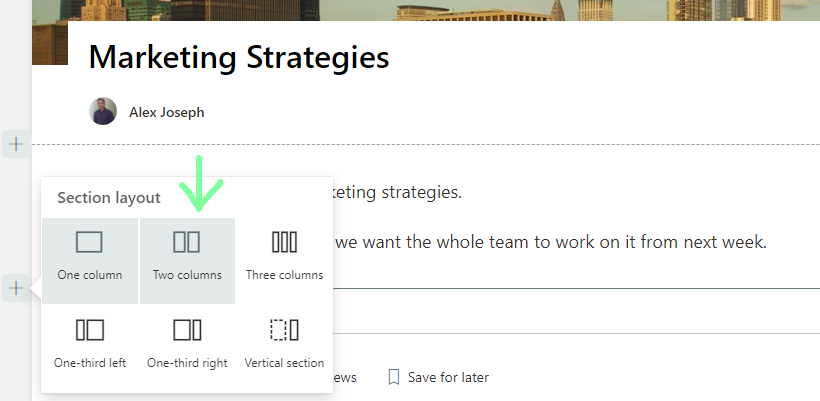
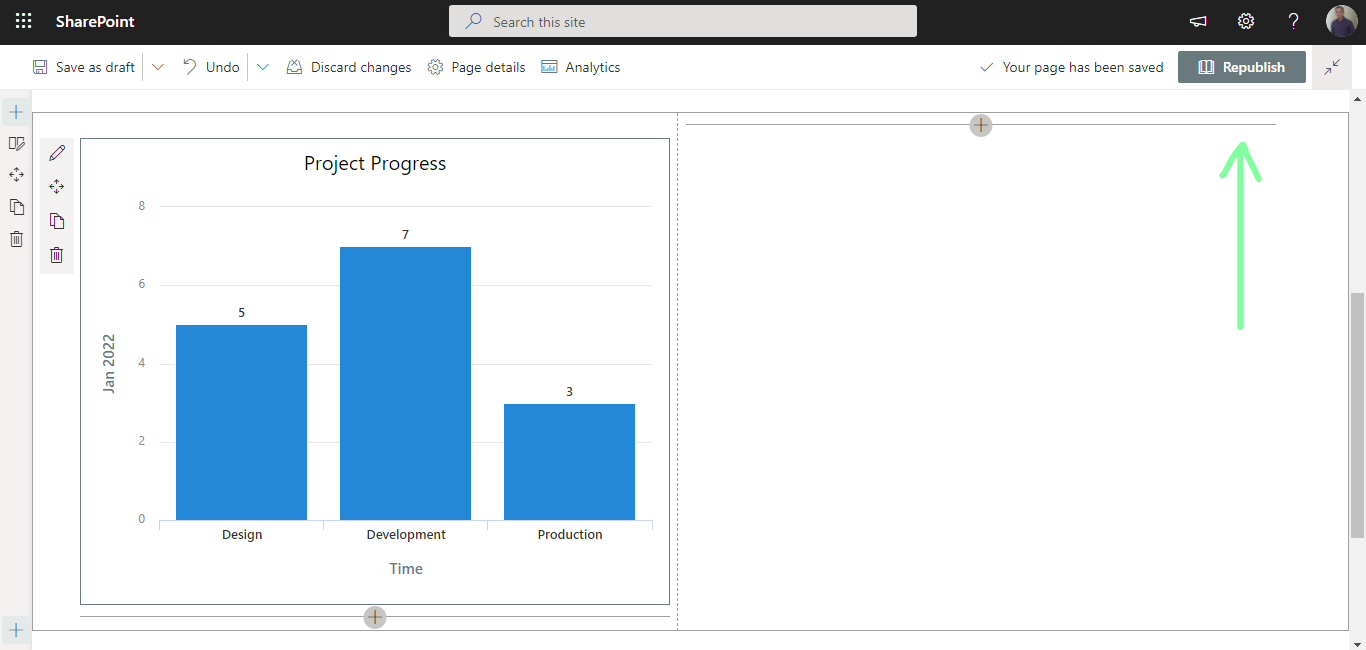
- Choose a layout for the new section. In this demonstration, we are selecting the Two columns section layout.
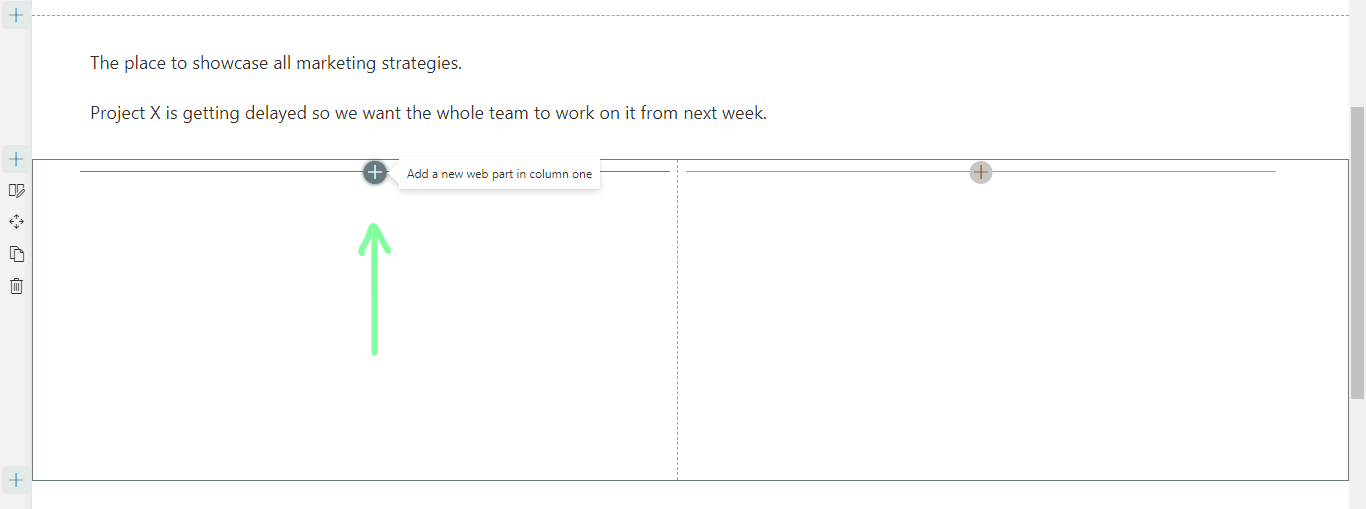
- The desired section is now added. To add the web part, click the + icon in the first column.
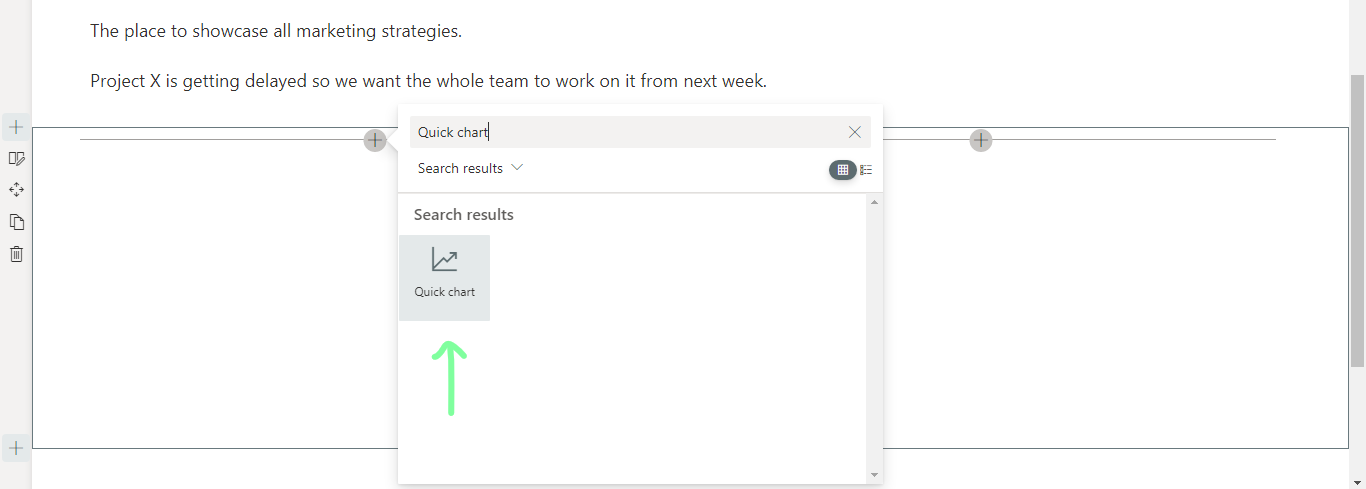
- From the new window that opens, search for "Quick chart" and choose the Quick chart web part from the results.
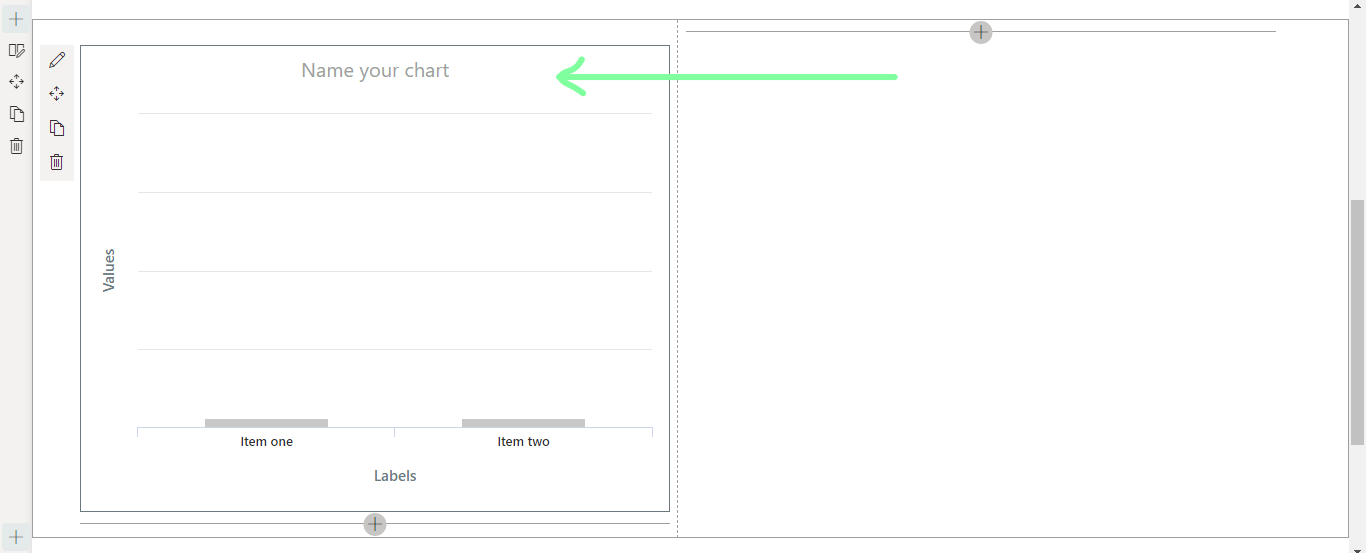
- The Quick Chart web art will be now added to the page.
- Give your chart a name.
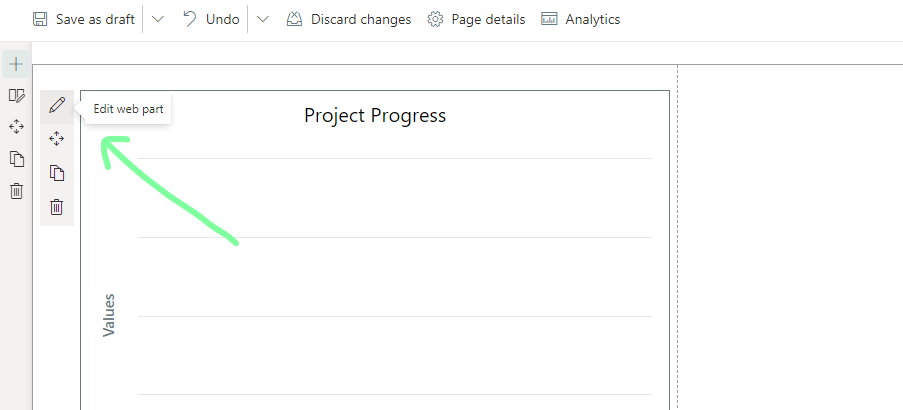
- Click on the pen icon in the top left corner of the web part to configure the web part.
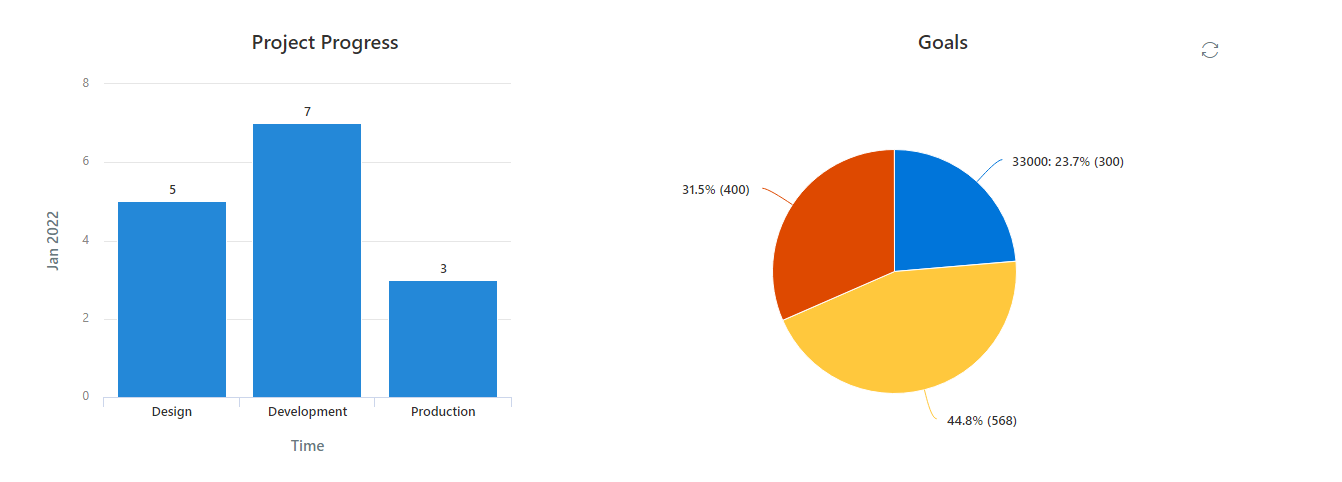
- Choose the desired Chart type.
- We have chosen the Column chart here.
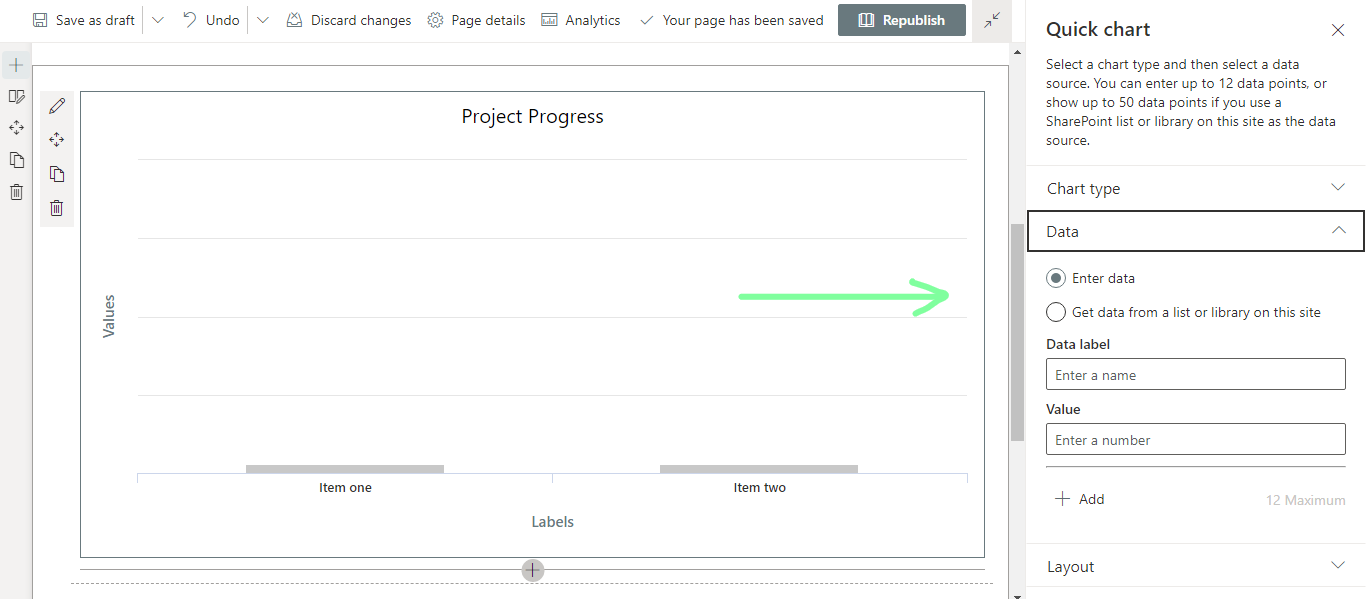
- In the data section, you can choose either Enter data or Get data from a list or library on this site to enter data into the chart.

- With the Enter data option, you can enter data manually by clicking on the + Add option.
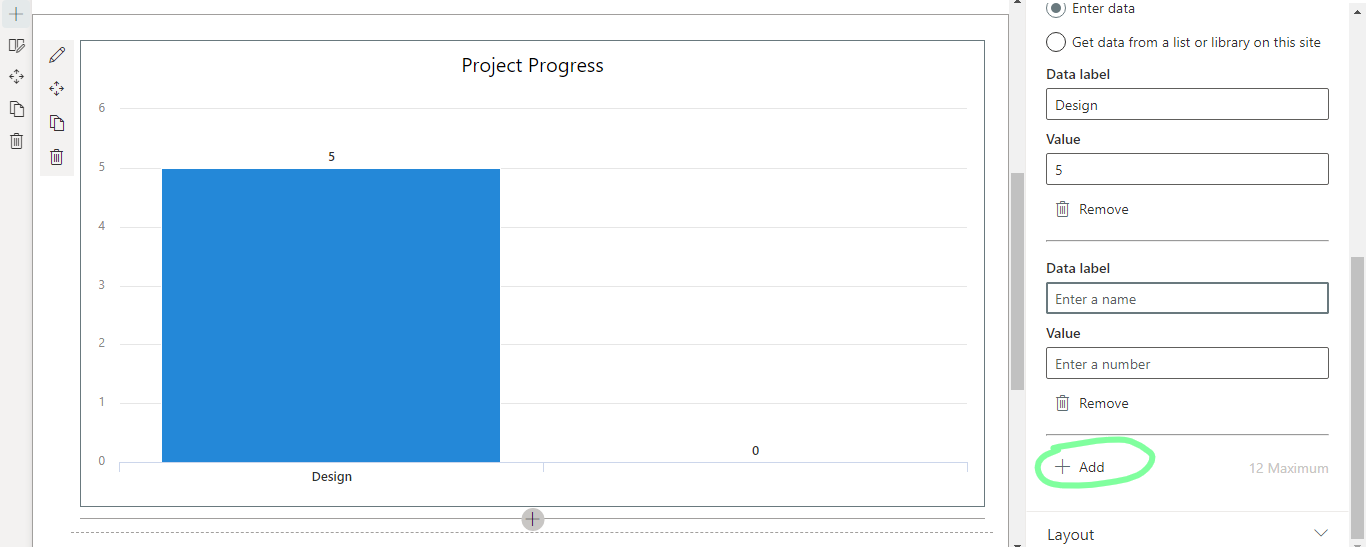
- Enter a Data label and Value.
- In the layout section, enter Horizontal axis and Vertical axis values.
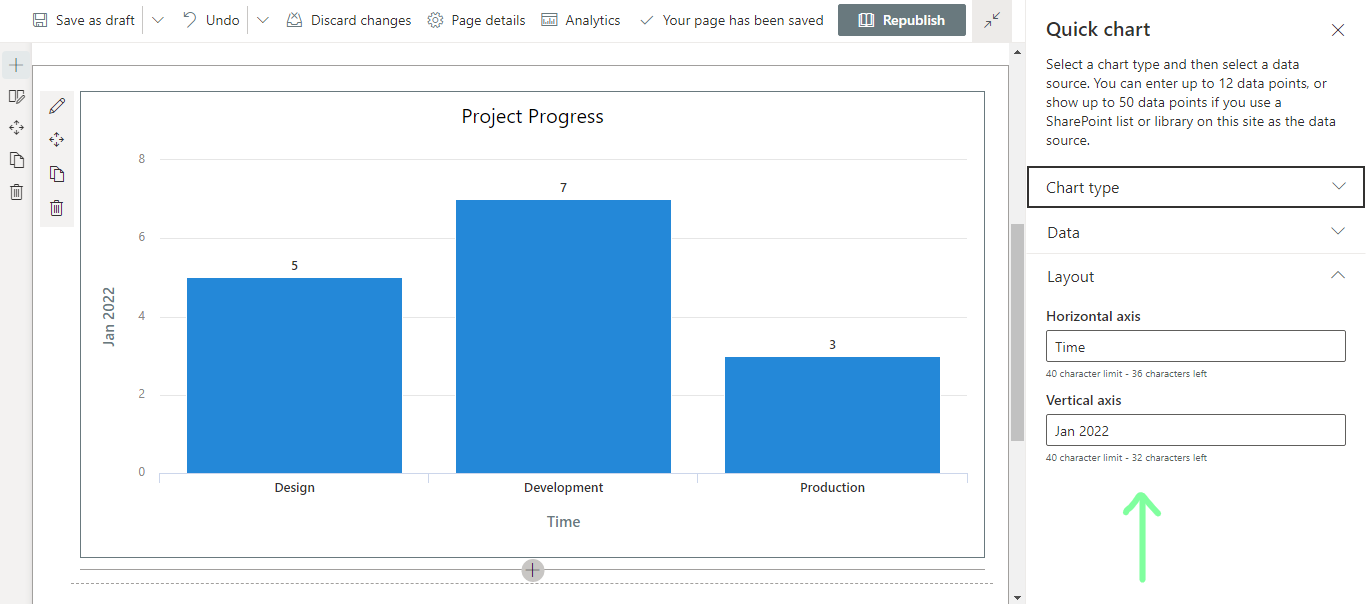
- Click Republish when complete.
To add a pie chart using the same web part and to retrieve data from an existing list on your site, follow the steps below.
- Refer to the steps above.
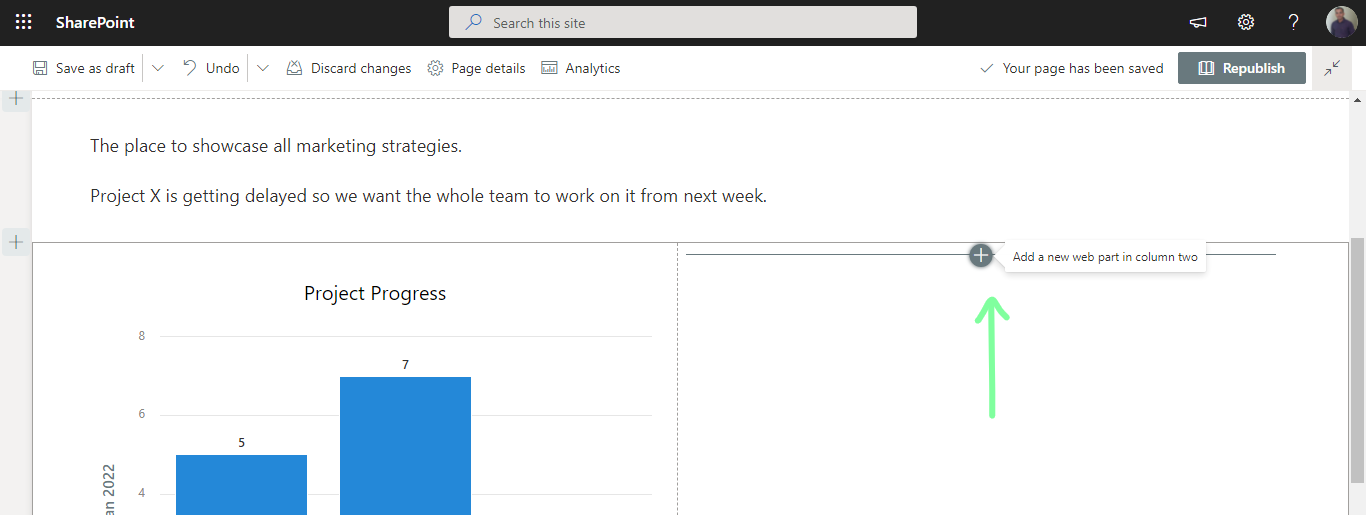
- Click on the + icon inside the second column and choose the web part again.
- Choose the chart type labled Pie chart.
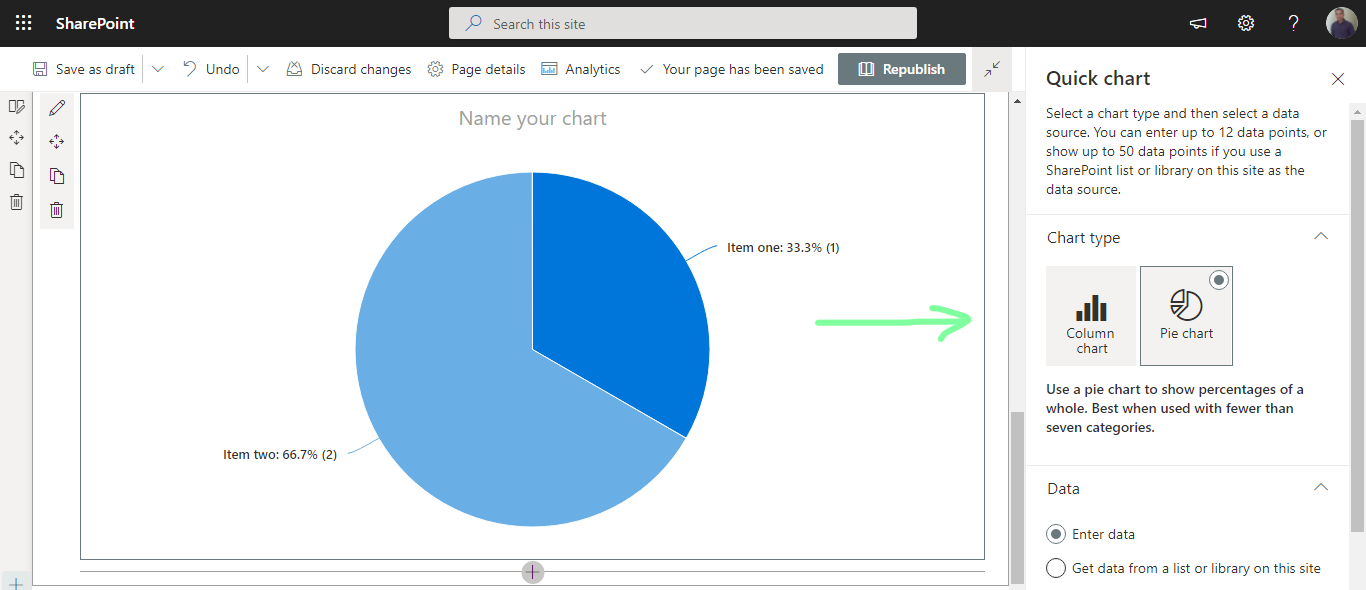
- In the data section, choose Get data from a list or library on this site.
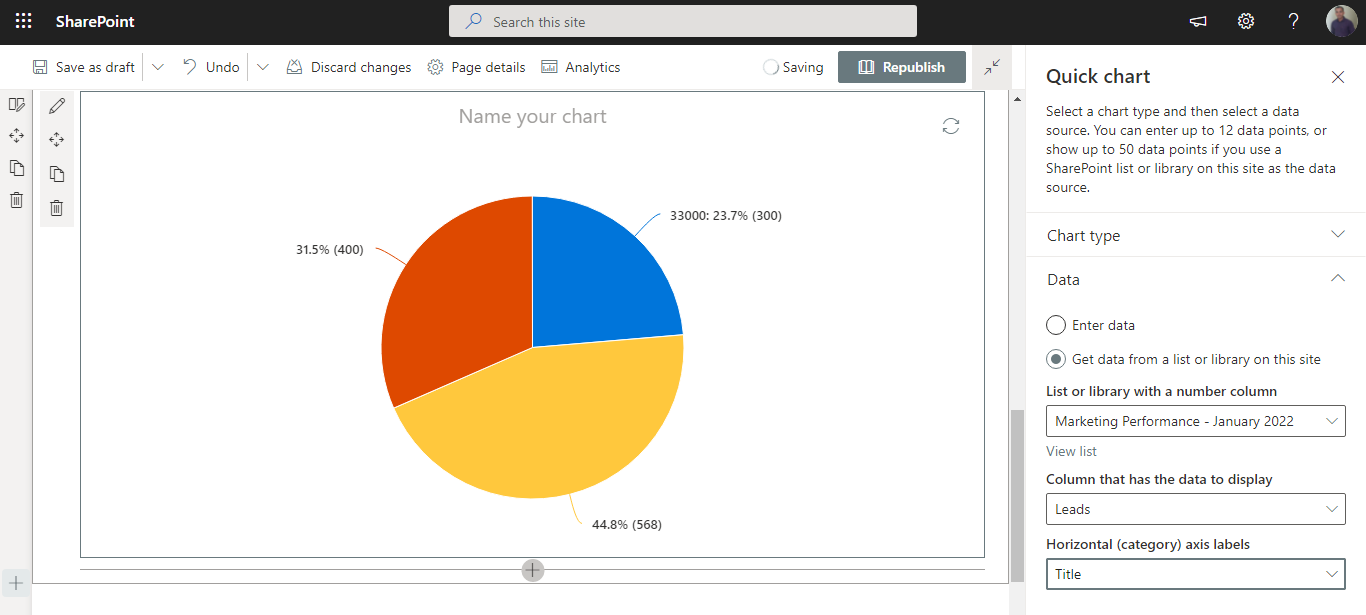
- Choose the desired list.
- Ensure that the list is properly formatted with data organized inside a table.
- Assign the column that data needs to be retrieved from and then configure labels for the horizontal axis.
- Provide a title for the chart.
- Click Republish when complete.
Display Charts in SharePoint with Additional Web Parts
Use the following web parts to display charts and graphs on SharePoint pages:

Please let us know about your experience using these web parts in the comments section below. Have a good day!
Book a Live demo
Schedule a live demo of Dock 365's Contract Management Software now.